Pediatric leukemia: genetic, molecular and clinical results in one database

Pediatric acute leukemia is a complex and rapidly changing disease. Successful treatment depends on an accurate, timely diagnosis and on choosing the most appropriate treatment protocol. To get there, treating physicians have to gather and interpret the results of many laboratory and molecular genetic tests: flow cytometry, cytogenetics, next-generation sequencing (NGS) and optical genome mapping.
These results arrive in different formats and at different times, so the diagnostic process can easily become fragmented. To address this challenge, we developed an integrated database and clinical data analysis software platform in collaboration with the Molecular Diagnostics Laboratory of the Department of Pathology and Experimental Cancer Research at Semmelweis University, as part of the Cooperative Doctoral Program.
Key takeaways
- Diagnosing pediatric acute leukemia and assigning a risk group require results from many laboratory methods to be interpreted together.
- The new platform organizes these results into a patient-level view and an interface that presents the entire patient cohort.
- In line with international treatment protocols, the system proposes a risk stratification and automatically updates it with new MRD results.
- By October 2026, it had processed data from close to 2,200 samples and some 3,500 diagnostic tests from more than 500 patients.
Why a child's leukemia diagnostic data are hard to keep track of
Accurate classification of pediatric acute leukemia requires cellular, chromosomal and molecular information at the same time. These come from different methods, run on separate instruments, each with its own format and turnaround time.
Meanwhile, the classification of the disease keeps getting more detailed. According to a review in Acta Haematologica, the two classification systems published in 2022, the 5th edition of the WHO classification (WHO-HAEM5) and the International Consensus Classification (ICC), together distinguish as many as 26 genetic subtypes of B-cell acute lymphoblastic leukemia (B-ALL).1 The more subtypes there are, the more test results have to be compared to reach a single classification.
New methods have also entered diagnostics. Optical genome mapping (OGM) maps copy number alterations and structural variants larger than 500 base pairs in a single test, in as little as five working days. The method was introduced in Hungary at the Molecular Diagnostics Unit of Semmelweis University, using samples from patients with acute leukemia (Bekő, Alpár, Bödör, 2023).2
In practice, this means that a patient's results are scattered across spreadsheets, reports and separate systems. Getting an overview is manual work, and every reassessment during treatment means comparing each new result with the earlier ones all over again.
What data the platform brings together
The platform combines complex genetic, molecular and clinical data in a single central interface. For each patient, results from the following test types are shown side by side:
| Test | What it shows |
|---|---|
| Flow cytometry | The proportion and characteristics of leukemic cells, MRD during treatment |
| Karyotyping | Numerical and structural chromosomal abnormalities |
| Fluorescence in situ hybridization (FISH) | Specifically targeted gene rearrangements and fusions |
| Multiplex ligation-dependent probe amplification (MLPA) | Copy number alterations (e.g. deletions) in genes of prognostic significance |
| Optical genome mapping (OGM) | Genome-wide structural variants and copy number alterations |
| RNA sequencing | Gene fusions |
| DNA sequencing | Point mutations and small insertions and deletions |
| Quantitative PCR-based MRD | Monitoring of residual disease at the molecular level |
Test types managed together for each patient on the platform.
Some results are imported from files, others are entered through structured forms. What matters is that every result is linked to the same patient and sample, in a consistent structure.
What clinicians see on a patient's record
The patient-specific summary view shows the full molecular profile, the course of residual disease and the risk stratification in a single interface.
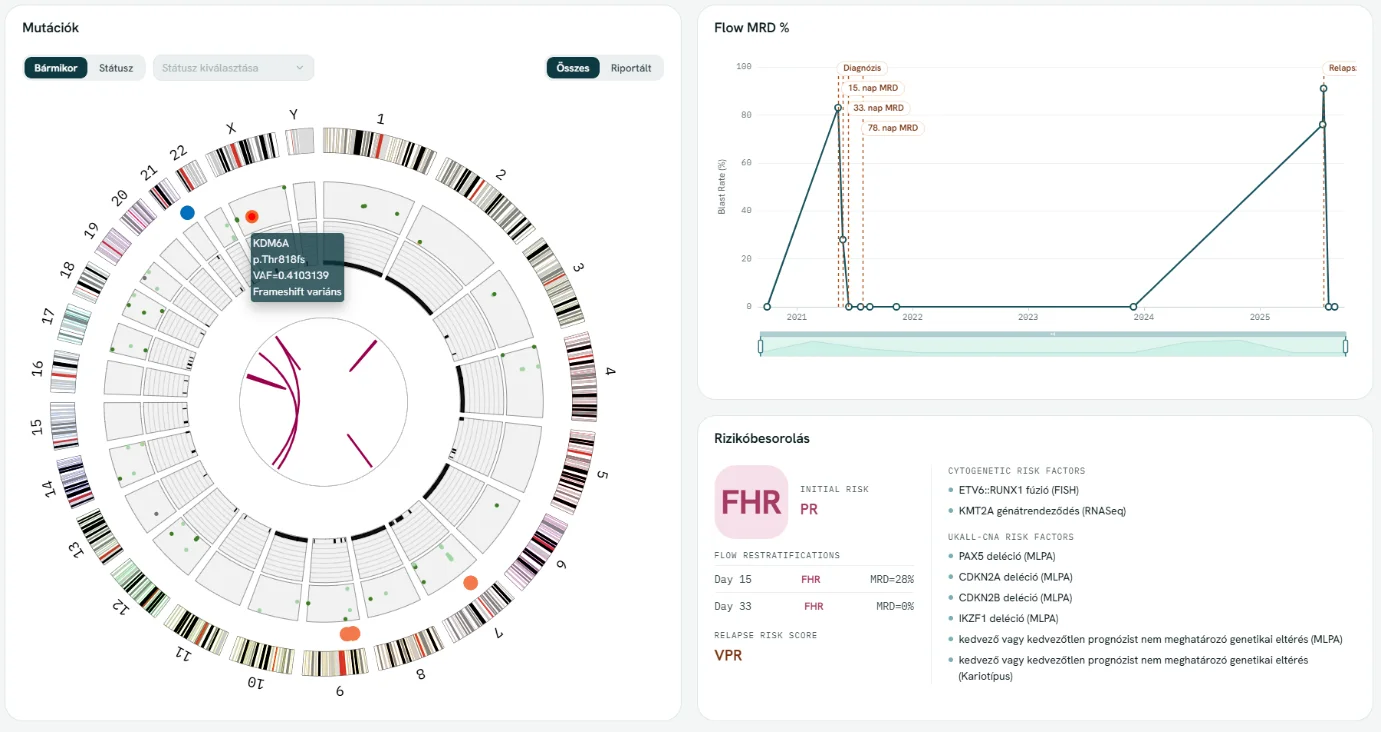
Summary view with the patient's digital karyotype, MRD chart and risk stratification.
The view has three main elements:
- Genome-wide Circos plot: the circular plot of the chromosomes shows point mutations, copy number alterations, structural variants and gene fusions together. Hovering over an element displays its details, such as the affected gene and the variant type.
- MRD timeline: minimal residual disease (MRD), the proportion of leukemic cells remaining after treatment, shown in chronological order with the diagnosis and key treatment days marked. This makes the treatment response easy to follow at a glance.
- Risk stratification: the initial risk group, any reclassifications during treatment, and the list of cytogenetic abnormalities and copy number alterations that determine them.
The platform's structured reporting module produces a summary with a consistent structure from the same dataset. The report includes the risk stratification, the cytogenetic and molecular results and the variants of prognostic significance. The expert adds their own interpretation to the report, supported by a catalog of alterations with literature references provided by the system.
How the system tracks changes in risk stratification
In the treatment of pediatric leukemia, the risk group is not only determined at diagnosis but reassessed several times during treatment. In line with international treatment protocols, the platform automatically calculates the patient's proposed risk group and updates it with every new measurement.
The initial proposal is based on the genetic results available at diagnosis. These include gene fusions and chromosomal abnormalities of prognostic significance, as well as copy number alterations such as deletions of certain genes. As soon as MRD values arrive on defined days of treatment (for example, days 15, 33 and 78), the system updates the patient's risk profile in real time.
Large international studies show why MRD-based reassessment matters. The AIEOP-BFM ALL 2000 study analyzed data from 3,184 children and adolescents (Conter et al., Blood, 2010). Five-year event-free survival was 92.3% in patients at standard risk by MRD, 77.6% in the intermediate-risk group and 50.1% in the high-risk group.3
5-year event-free survival in the MRD standard-risk vs. high-risk group — AIEOP-BFM ALL 2000, Conter et al., Blood, 2010
Interpreting genetics and MRD together can sharpen the picture further. According to an analysis of 3,113 patients in the UK UKALL2003 trial, the same MRD level carries a different risk of relapse depending on the genetic subtype. The authors therefore recommend taking genetics and MRD into account together (O'Connor et al., Journal of Clinical Oncology, 2018).4 This is exactly what requires both data types to be available in one place, linked to each other.
The risk group calculated by the system is a proposal: the treatment decision is always made by the treating physician.
What the overview of the entire patient cohort shows
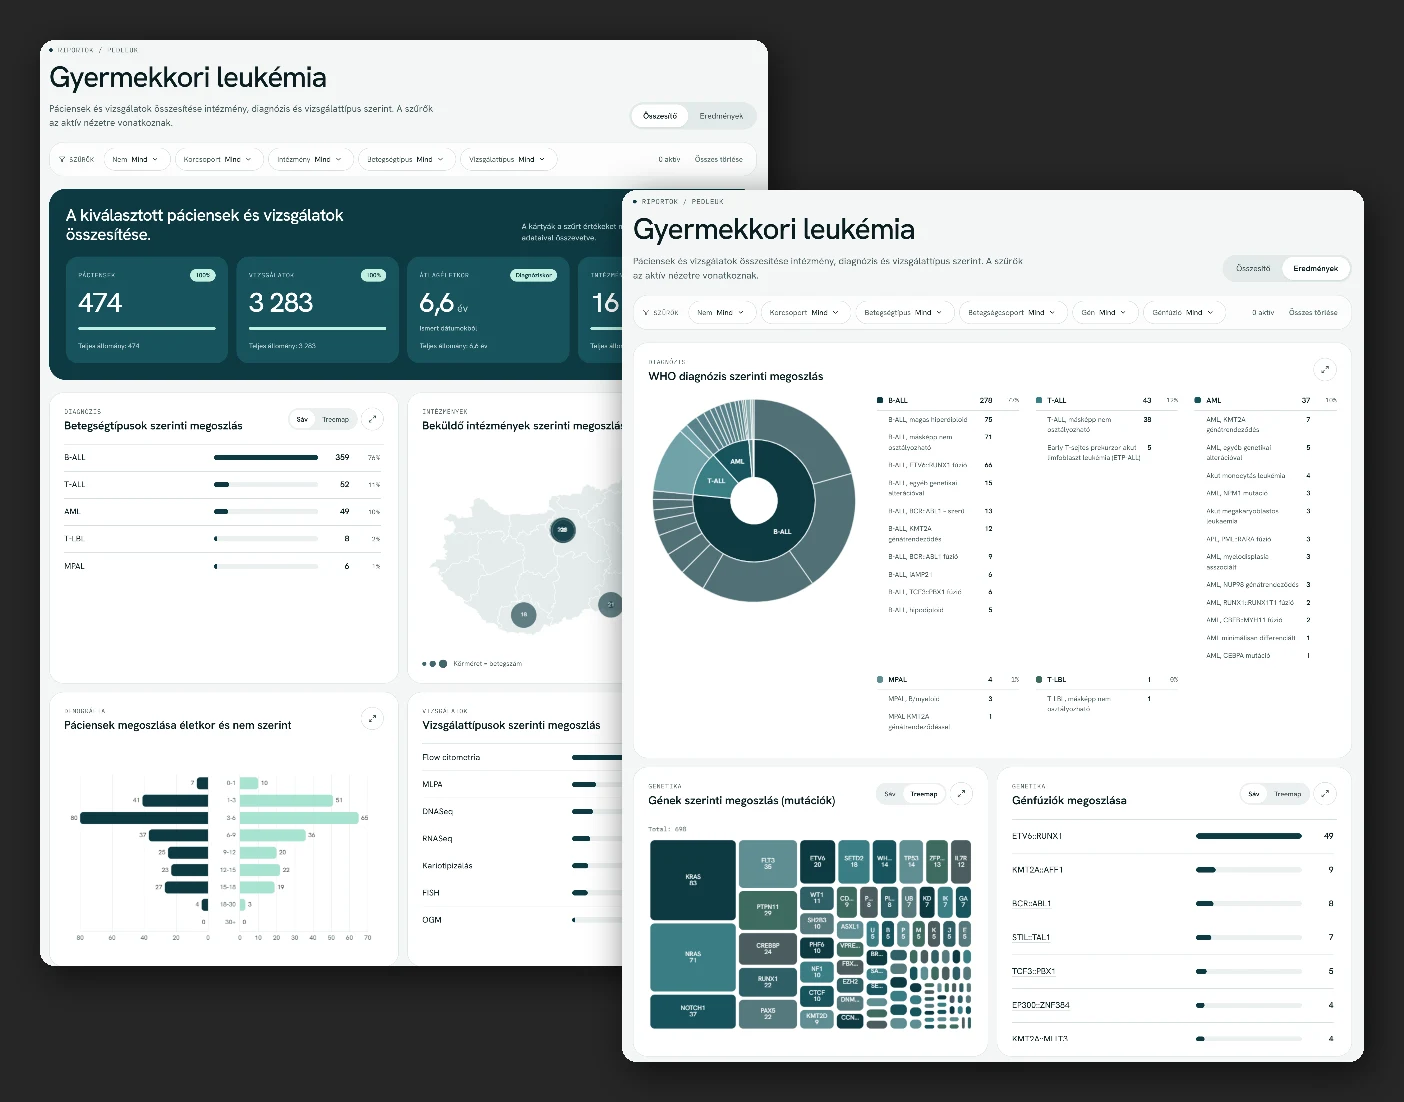
The platform includes an interactive, filterable dashboard that presents data on the entire patient cohort. From there, users can drill down to detailed data on specific patient groups or individual cases.
The summary view can be filtered by sex, age group, institution, disease type and test type. A map shows the distribution by referring institution, giving a clear picture of care across the country.
The results view summarizes diagnoses and genetic alterations. It shows the distribution by WHO diagnosis, the genes involved and the most common gene fusions. Clicking a gene or fusion takes the user to detailed results for the affected patient group.
How the system protects patient data
In a pediatric oncology database, data protection is a basic requirement. The system uses role-based access control: each user can access only the data that matches their role, and the visibility of patient data can be restricted to the user's own institution.
The platform also offers natural-language querying, which lets users ask aggregate questions about the dataset. This feature runs only on aggregated data, and the system masks groups with small case numbers.
Where the project stands
Real-world data from everyday diagnostic work confirm that the system performs efficiently and can scale to larger data volumes. By October 2026, the system had integrated and processed data from close to 2,200 samples and some 3,500 diagnostic tests from more than 500 patients.
diagnostic tests from close to 2,200 samples of more than 500 patients, in one integrated system — Internal data, Genontech and Semmelweis University, October 2026
The development was carried out as part of the Cooperative Doctoral Program. This program enables doctoral research in collaboration with a company: the doctoral student's research serves both academic work at the university and the development of a real-world application.5
What this means for treating physicians and research
The integrated platform bridges state-of-the-art molecular genetic diagnostics and everyday clinical practice. The aim of the development is to make diagnostic work faster and more transparent, so that children with leukemia can receive the treatment best suited to them as soon as possible.
To this end, the system provides four things:
- Unified data: instead of being compiled by hand, the results of different tests are available in one place, in a consistent structure.
- Clear visualization: the full molecular profile and the treatment response can be followed in a single interface.
- Real-time reclassification: when new MRD results arrive, the proposed risk stratification is updated automatically.
- Standardized report: the summary has the same structure for every patient and can be supplemented with expert interpretation.
A structured, linked dataset also provides a foundation for research. Cohort-level analyses, studies of rare genetic subtypes and future predictive models all depend on recording data consistently as part of the clinical workflow.
Would you like to manage clinical and laboratory data from multiple sources in one place, in a form ready for analysis?
Let's talkSources
-
Østergaard A., Iacobucci I.: Genomic Subclassification and Risk Stratification of ALL. Acta Haematologica, 2026; 149(1): 8–23. A summary of B-ALL subtypes according to WHO-HAEM5 and the ICC. ↩
-
Bekő Anna, Alpár Donát, Bödör Csaba: Optikai genomtérképezés onkohematológiai megbetegedésekben (English: "Optical genome mapping in hemato-oncological diseases"). Hematológia–Transzfuziológia, 2023; 56(1): 29–34. Article in Hungarian. ↩
-
Conter V. et al.: Molecular response to treatment redefines all prognostic factors in children and adolescents with B-cell precursor acute lymphoblastic leukemia: results in 3184 patients of the AIEOP-BFM ALL 2000 study. Blood, 2010; 115(16): 3206–3214. ↩
-
O'Connor D. et al.: Genotype-Specific Minimal Residual Disease Interpretation Improves Stratification in Pediatric Acute Lymphoblastic Leukemia. Journal of Clinical Oncology, 2018; 36(1): 34–43. ↩
-
National Research, Development and Innovation Office (NKFIH): Útmutató az EKÖP-KDP programhoz (English: "Guide to the EKÖP-KDP program"). In Hungarian. ↩