How does health data become clinical decision support?

Health data becomes clinical decision support when it is captured in a structured way during clinical work. The same data assets have to serve the decision at the bedside, the institutional report and the research analysis. Artificial intelligence and predictive models build on this foundation; they do not replace it.
Genontech presented this approach in July 2026 at the BIOMED-DATA 26 conference of Semmelweis University, with four projects from four different clinical areas. This article places the four projects in a single framework, organized by level of decision support, from the bedside to population-level analysis.
In brief
- Clinical decision support helps the treating physician decide by providing the right information at the right time. It does not make the decision for them.
- In most institutions, what is missing is not the algorithm but structured, linkable data.
- In Genontech's practice, we distinguish four levels of decision support: the point of care, the patient-level and institutional overview, analytical drill-down, and predictive and real-world data analysis.
- All four levels build on the same data assets. This is why the quality of data capture determines what analytics will be able to do later.
What clinical decision support means
Clinical decision support (CDS) is a health IT function that gives people involved in patient care person-specific information, intelligently filtered and organized, at the appropriate time. According to the definition used in US health regulation, its goal is to improve health and the quality of care.1
The literature puts the same idea from the clinician's point of view: a decision support system assists medical decision-making with targeted clinical knowledge, patient data and other health information.2 This covers an alert in the hospital system, an automatically generated draft report, a suggested risk classification and a quality indicator at department level alike.
For practical design, the CDS Five Rights offer a good starting point. According to this framework, decision support is useful when it delivers
- the right information,
- to the right people, including the whole care team and the patient,
- through the right channel,
- in the right format,
- at the right point in the workflow.1
Four of the five elements are not about the algorithm but about how support fits into clinical work. This is the essence of decision support, and the rest of this article follows from it.
Why health data does not become decision support on its own
Care generates vast amounts of data, yet everyday work often still runs on a few Excel spreadsheets, printed sheets and personal records. In our project experience, putting together a clinical report this way often turns into a separate task that takes several weeks. The same obstacles come up again and again:
| Obstacle | What happens in practice? |
|---|---|
| Excel and paper | Registries, treatment logs and follow-up lists are kept in several unconnected Excel spreadsheets, and it is unclear which one is the latest version. |
| Fragmented sources | Seeing a patient's complete data requires several systems (hospital information system, laboratory, EESZT, registry). |
| Information locked in text | Clinically relevant data stays in the free text of reports, and aggregating it requires manual reading. |
| Cumbersome data entry | Too many clicks and hard-to-search lists result in incomplete data. |
| After-the-fact paperwork | Whatever is not recorded during care is entered later, from memory, and less accurately. |
| Small case numbers | In rare diseases and small patient groups, every missing data point is a significant loss for research. |
EESZT (Elektronikus Egészségügyi Szolgáltatási Tér, or Electronic Health Service Space) is Hungary's national eHealth infrastructure, the central system for health data exchange in the country. Every row of the table leads to the same conclusion: a report built on incomplete, fragmented data has limited reliability.
An international review points the same way. According to an article in npj Digital Medicine, data quality affects the quality of decision support, and decision support systems often struggle with a lack of interoperability between systems. The same review cites studies in which up to 95% of alerts were inconsequential.2 Too many irrelevant alerts lead to "alert fatigue": clinicians can easily skip even the important warnings.
Why workflow is the key to decision support
Whether decision support succeeds depends above all on whether it is part of clinical work. In a systematic review of 70 randomized controlled trials by Kawamoto and colleagues, decision support systems significantly improved clinical practice in 68% of the trials.3
The authors identified four features that were independent predictors of success. The strongest was that the system provided support automatically, as part of the clinician's workflow. Of the 32 systems that had all four features, 30, or 94%, significantly improved practice.3
of workflow-integrated decision support systems with all four success features significantly improved clinical practice (30 of 32) — Kawamoto et al., BMJ, 2005
The study measured how support was delivered, not how data was captured. Genontech applies the same logic to data capture, because the quality of analysis depends on the quality of data capture. The order is therefore: first, data capture that fits the workflow, then advanced analytics. Predictive modeling is a payoff of well-built data assets, not a precondition for getting started.
In practice, this means three things:
- An interface that follows clinical logic: screens follow the flow of medical reasoning, which means fewer clicks and fewer opportunities for error.
- Data capture during care: data is recorded during the examination, the ward round or the procedure, not afterward.
- Immediate feedback: the recorded data produces a draft report, a trend chart or a clinical score, with no further manual work.
When data capture benefits the clinician right away, the data becomes more complete. And more complete data is the foundation of every further level of decision support. Why clinical data already goes wrong at the point of capture is explained in detail in our article on data-driven healthcare and the Smart Registry.
The four levels of clinical decision support
In Genontech's practice, we distinguish four levels of decision support. The bedside view, the institutional report and the analytical drill-down all build on the same data assets. The levels do not replace one another but stack on top of each other: each level draws on the data of the one before it.
| Level | Who uses it? | What question does it answer? | Example from Genontech projects |
|---|---|---|---|
| 1. At the point of care | Care team, treating physician | What is happening to the patient now, and what is the next step? | NeoTracker |
| 2. Patient-level and institutional overview | Treating physician, head of department, diagnostic lab | What do all of the patient's results show together? How is the department performing? | Pediatric leukemia platform |
| 3. Analytical drill-down and self-service analysis | Clinical researcher, quality manager, health economist | In which patient group, and along which factors, do outcomes differ? | Pediatric leukemia platform |
| 4. Predictive and real-world data analysis | Researcher, professional decision-maker, payer | Who is likely to be at risk? What does a research finding mean for Hungarian patients? | ARIANA, NEVADA |
Level 1: decision support at the point of care
The first level works at the patient's bedside. Here, measured parameters, interventions and outcomes appear in a single chronological view, where the system can also highlight important deviations. At this level, decision support often simply means that the information needed is there at the right moment.
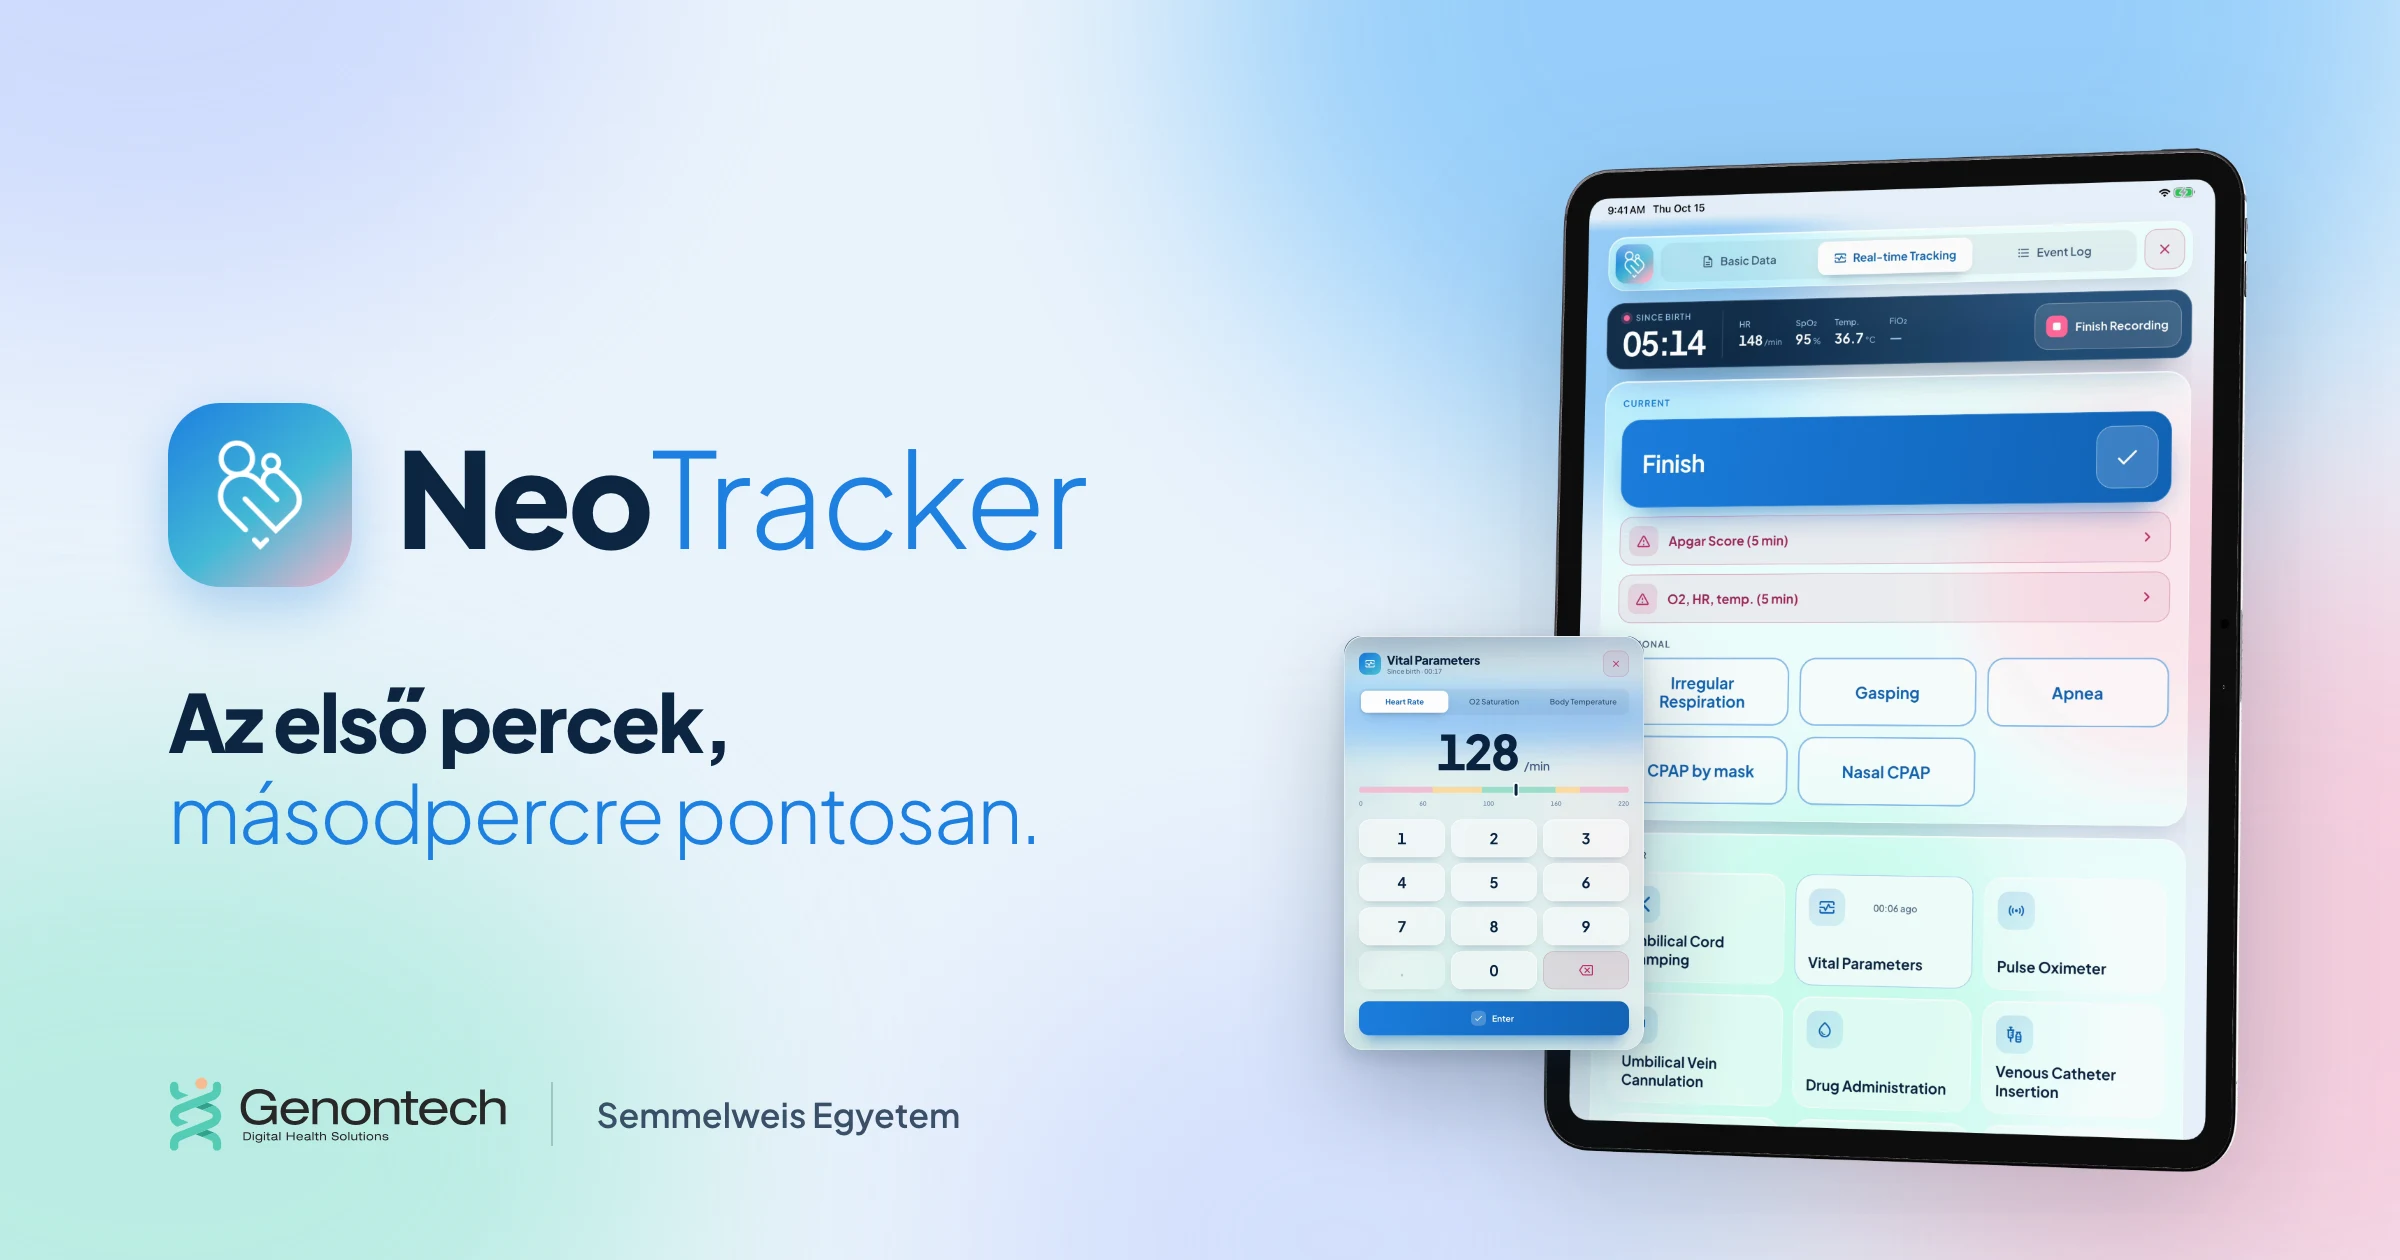
One example is the NeoTracker digital delivery room event log, which we developed together with specialists at the Department of Obstetrics and Gynecology, Semmelweis University. The application records the interventions performed and the physiological parameters measured during the newborn's stabilization in the delivery room, in real time and with time stamps.4
The interface follows the logic of the European newborn resuscitation guideline, Newborn Life Support (NLS).4 Data capture produces automatically exportable documentation, so an accurate timeline is available instead of a record written up afterward from memory. The next development direction is monitor integration and voice-controlled data entry.4
Level 2: patient-level and institutional overview
The second level organizes the same data into a unified picture. At patient level, this means the complete medical history in one view; at institutional level, department or network indicators, without manual data collection.
This matters most in complex diagnostic areas. Classifying acute leukemia in children requires interpreting genetic, molecular and clinical results together, which come from different testing methods, in different formats and at different times.
The multimodal database and clinical data analysis platform developed with the Molecular Diagnostics Laboratory of the Department of Pathology and Experimental Cancer Research, Semmelweis University, brings these results together in a single patient-level view. In line with international treatment protocols, the system suggests a risk classification and updates it as new results arrive. The final decision is made by the treating physician.
Level 3: analytical drill-down and self-service analysis
The third level goes beyond static reports to serve clinical researchers, quality managers and health economics professionals. With self-service analytics tools, users can filter and analyze data without involving a software developer.
The key is drill-down: in a few clicks, users can get from an aggregated institutional or national indicator to a specific patient group. This is one of the most direct ways to test research hypotheses and lay the groundwork for clinical improvements.
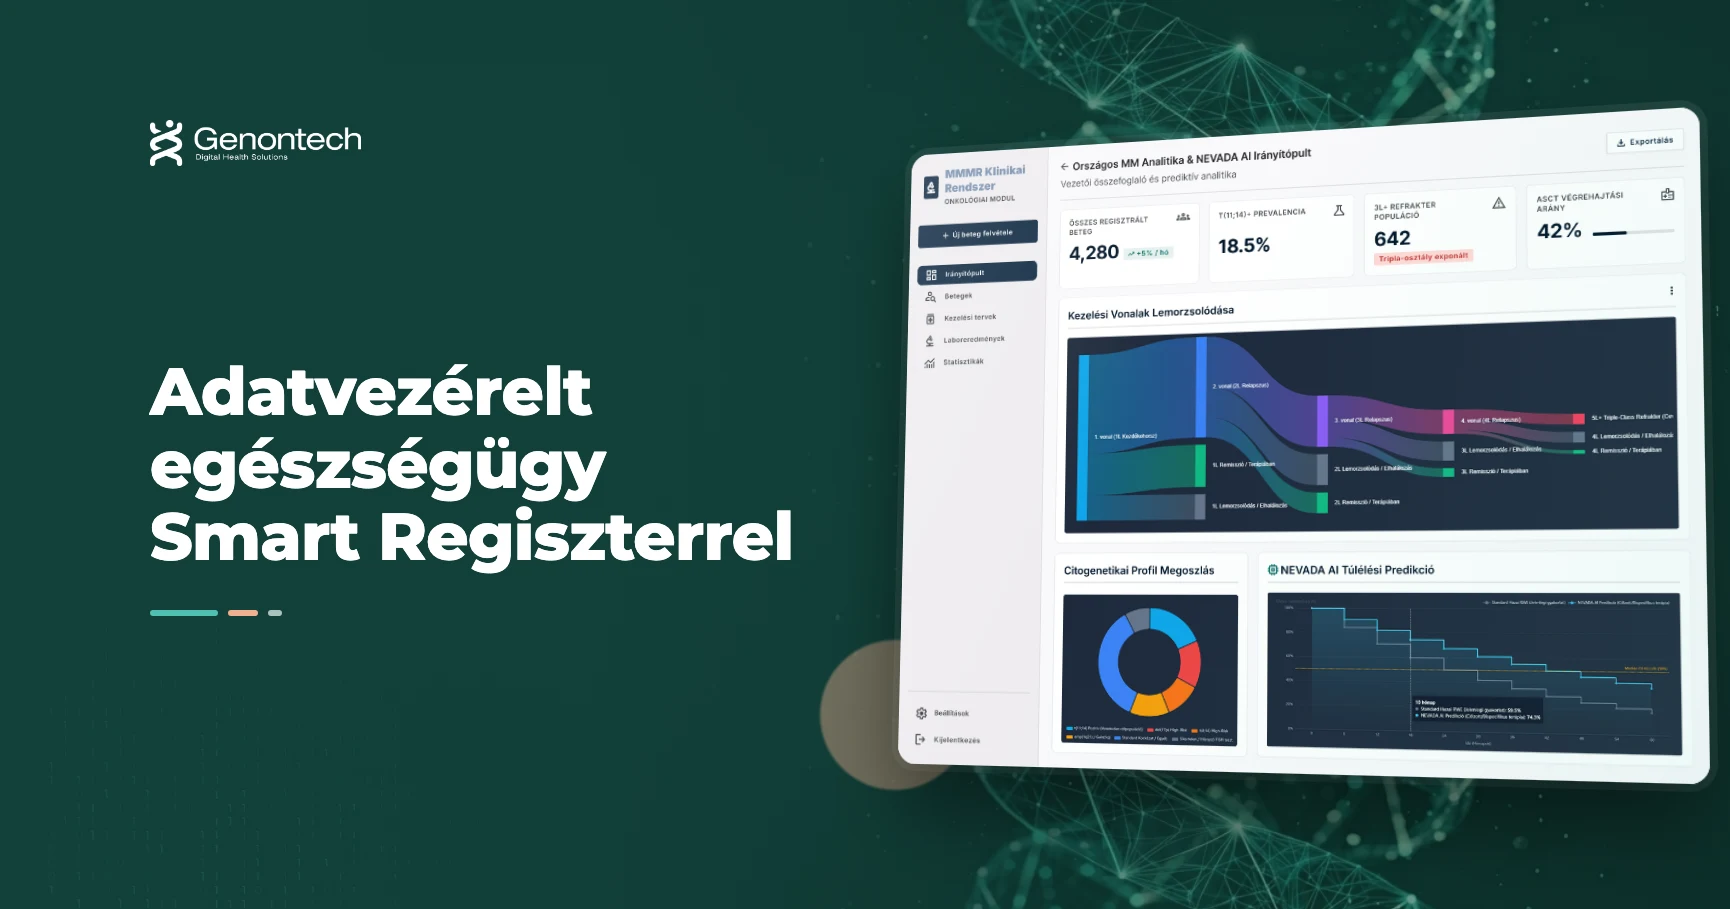
The interactive dashboard of the pediatric leukemia platform is a good example. The summary view can be filtered by sex, age group, referring institution, disease type and test type. By clicking on a gene or gene fusion, users can reach the detailed results of the patient group concerned.
Level 4: predictive and real-world data analysis
The fourth level creates new knowledge from existing data assets. This includes risk estimation, complication and capacity modeling, and analysis based on real-world care data (real-world evidence, RWE). This level can be unlocked without a separate data collection project if the data from the first three levels is available in structured form and with full clinical context.
Two of the projects we presented at the conference belong to this level.
ARIANA: cardiac risk in existing ECG data. The ECG is one of the oldest and most widely available tests in clinical practice, yet much of its prognostic potential remains untapped. The ARIANA project explores how ECG data can help identify risk patterns associated with atrial fibrillation and sudden cardiac death earlier.
This direction is well grounded internationally. Researchers at Mayo Clinic showed in The Lancet that an ECG recorded during normal sinus rhythm can also indicate atrial fibrillation. In their retrospective analysis, patients with atrial fibrillation could be identified from a single ECG analyzed by artificial intelligence (AUC 0.87).5 ARIANA aims to build a data management and analysis framework that can deliver clinically interpretable results. The framework can later be extended with long-term cardiac monitoring data and genetic characteristics.
NEVADA: research findings for the Hungarian patient population. The results of clinical trials apply to a strictly selected study population, but decision-makers have to draw conclusions about their own patients. In epidemiology, this question is studied as extending trial results to a target population, known as transportability.6
The NEVADA methodology links published clinical evidence with aggregated Hungarian real-world data, using artificial intelligence and synthetic patient cohorts. A synthetic cohort contains no identifiable patient data. The aim is to still provide an estimate that is meaningful for a given patient population and can inform the preparation of drug reimbursement and funding decisions.
What connects the four projects
The four projects come from four different areas: newborn care, pediatric hematology-oncology, cardiology and health economics. What they share is the approach: each starts from a specific clinical question and shapes the data structure around it.
Genontech presented the projects on July 15–17, 2026, at the 2nd Biomedical Data Science Conference (BIOMED-DATA 26), organized by the Institute of Biostatistics and Network Science, Semmelweis University.7 The conference brought together researchers, clinicians and developers working in biomedical data science.
The Genontech team at the BIOMED-DATA 26 conference, Budapest, July 2026. Photo: Genontech.
IBT Consulting is also our partner in this work: together, we align the clinical, research, technology and communication aspects. The organizers' highlights video captures the atmosphere of the conference.
Where should an institution start?
A decision support project rarely starts where the idea does. The idea is usually born at the fourth level ("we would like to estimate risk"), but implementation starts at the first. In our projects, the following order has worked well:
- A precise clinical question. Which decision needs support, who makes it, and when? This shows what data is needed, and at what level of detail.
- Where data is captured. Where in the workflow is the data generated, and who records it? If data is recorded after the fact, its quality will reflect that.
- Data model and linkage. All data linked to the patient, in a consistent structure. Connections with existing systems (hospital information system, EESZT, laboratory) are best settled at the design stage.
- Access rights, data protection, regulation. Role-based access, the GDPR conditions for health data and ethics approvals for research use, from day one. It is also worth clarifying early whether the software qualifies as a medical device.
- Reports and feedback. The first tangible result should be something the clinician uses right away: a report, a trend, an overview.
- Advanced analytics. A predictive model, a synthetic cohort or an RWE analysis, once the data assets are complete enough to support it.
The details of the first four steps, from the legal basis through the data model to the EESZT connection, are covered in our article on data-driven healthcare and launching a patient registry.
The data collection foundation for this is provided by the Smart Registry, and advanced analysis by Genontech's AI-powered health data platform.
What clinical decision support cannot do
The limits of decision support are worth knowing just as precisely as its possibilities.
- It does not make decisions. It provides suggestions, highlights and connections. Responsibility and the decision remain with the treating physician.
- It does not make up for missing data. A model built on poor-quality or incomplete data can produce misleading results, however advanced the algorithm.2
- It does not work without validation. A model developed on an international cohort may perform differently on Hungarian patients, so local validation is needed.
- It does not work if there are too many alerts. Too many warnings are counterproductive, so every alert has to be clinically justified.
Summary: from data to knowledge, from knowledge to clinical value
Health data does not become clinical decision support in a single step. The path starts with data capture embedded in the workflow, then leads through a unified patient-level and institutional picture and analytical drill-down to predictive and population-level analysis.
The four projects presented at BIOMED-DATA 26 each illustrate one stage of this path. Technology alone is not enough: it takes a precise understanding of the clinical question, the right data structure and results that can be applied in practice.
Would you like to build clinical decision support from the data of your institution or research program?
Let's talkSources
-
Centers for Medicare & Medicaid Services, Office of the National Coordinator for Health IT: Clinical Decision Support: More than Just 'Alerts' Tipsheet. 2014. Summary of the regulatory definition of CDS (75 FR 44350) and the "CDS Five Rights" (Osheroff et al., 2012). ↩ ↩2
-
Sutton R. T. et al.: An overview of clinical decision support systems: benefits, risks, and strategies for success. npj Digital Medicine, 2020; 3: 17. ↩ ↩2 ↩3
-
Kawamoto K., Houlihan C. A., Balas E. A., Lobach D. F.: Improving clinical practice using clinical decision support systems: a systematic review of trials to identify features critical to success. BMJ, 2005; 330(7494): 765. ↩ ↩2
-
Bogner Luca Laura et al.: NeoTracker - saját fejlesztésű digitalizált eseménynapló az újszülöttek szülőszobai stabilizációjáról (English: "NeoTracker: an in-house digital event log of neonatal stabilization in the delivery room"). Orvosi Hetilap, 2026; 167(15): 595–604. Article in Hungarian. ↩ ↩2 ↩3
-
Attia Z. I. et al.: An artificial intelligence-enabled ECG algorithm for the identification of patients with atrial fibrillation during sinus rhythm: a retrospective analysis of outcome prediction. The Lancet, 2019; 394(10201): 861–867. ↩
-
Dahabreh I. J. et al.: Study Designs for Extending Causal Inferences From a Randomized Trial to a Target Population. American Journal of Epidemiology, 2021; 190(8): 1632–1642. ↩
-
Semmelweis University, Institute of Biostatistics and Network Science: 2nd Biomedical Data Science Conference (BIOMED-DATA 26). Budapest, July 15–17, 2026. ↩